


What does HomeLet & Let Alliance's UK Rental Affordability Report mean for letting agents and landlords?
Our latest HomeLet UK Rental Affordability Report tracks applications processed between January 2025 and August 2026, using millions of tenant references from across the country.
By comparing typical rents with tenant incomes, we calculate a rent‑to‑income affordability ratio - the share of income spent on rent. Many housing frameworks see 40% of gross pay as the outside edge of what is sustainable. Anything consistently above that starts to put serious pressure on household budgets.
This report looks at:
- How much of their income tenants are spending on rent across the UK
- Regional differences between the South and the rest of the country
- How affordability varies by age
- What rising guarantor usage tells us about financial resilience
- What all this means for landlords and letting agents trying to secure reliable, long‑term tenants
Key UK rental affordability statistics for 2026
Our headline findings show that affordability remains tight, even outside the very highest‑priced markets:
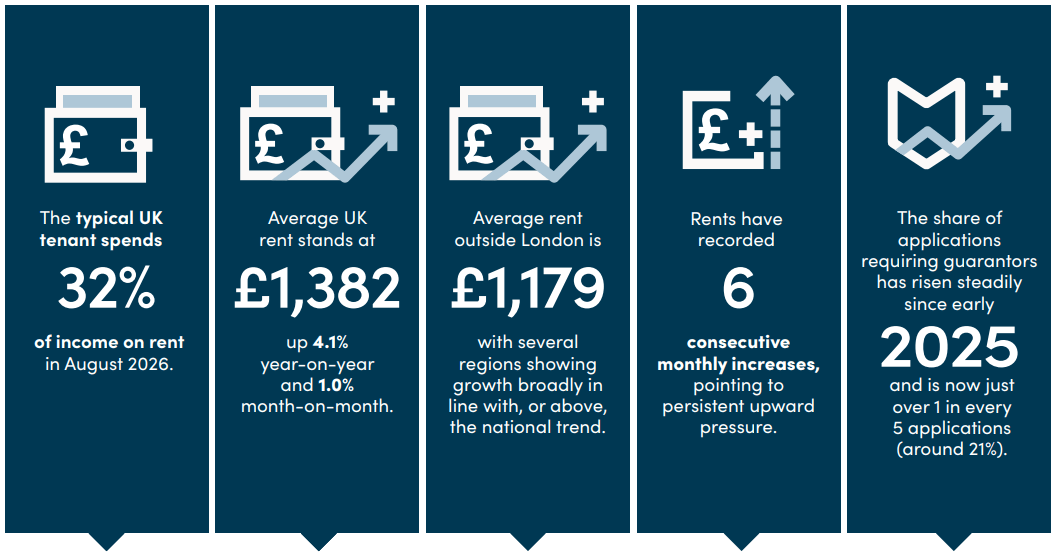
- The typical UK tenant now spends 32% of their gross income on rent.
- Average UK rent is £1,382, up 4.1% year‑on‑year and 1.0% month‑on‑month.
- Average rent outside London is £1,179, with several regions growing broadly in line with - or above - the national trend.
- Rents have risen for six consecutive months, underlining persistent upward pressure.
- The share of referencing applications requiring a guarantor has climbed steadily since early 2025 and now stands at just over one in five applications (around 21%).
On paper, 32% is below the 40% affordability threshold. But with rents still rising and wider living costs elevated, many tenants are operating with little room for error - especially in the most expensive parts of the country.
UK renters are edging towards the affordability line
Across the UK, the average renter is devoting roughly a third of their income to housing costs. While that single figure offers a useful benchmark, it hides important variations. In higher‑cost areas, tenants are edging closer to the 40% affordability line, with some groups approaching or surpassing it. In more affordable regions, tenants still face a significant housing cost burden but retain a little more capacity to absorb income shocks or unexpected expenses.
For landlords and letting agents, this means that a simple income multiple no longer tells the full story. Two applicants earning the same amount can have very different levels of financial resilience, savings and support behind them. Understanding affordability now requires a more nuanced view that takes account of both the rent‑to‑income ratio and the context in which that tenant is renting.
The South vs the rest - regional rental affordability
The regional data confirms a familiar but important pattern: a clear divide between London and the South and other parts of the UK. London remains the least affordable region, with tenants spending 37.9% of their income on rent. The South East also looks stretched, with tenants spending around 32.5% of their income on rent, still more than a third of gross pay. The South West and the East of England also sit towards the less affordable end of the spectrum, with rent‑to‑income ratios above those seen in many northern and devolved‑nation regions.
By contrast, some areas remain relatively more affordable, even though pressures are still evident. In the North East, tenants spend around 31.1% of income on rent, while in Yorkshire & The Humber the figure falls to 28.4%, one of the lowest ratios in the UK. Regions such as the East Midlands, Wales, the West Midlands and Scotland also tend to track below the levels seen in London and the South East.
The gap between London’s 37.9% and the North East’s 31.1% amounts to almost seven percentage points, clearly illustrating how uneven rental pressure has become. For agents and landlords, this means that pricing, tenant expectations and risk profiles can differ sharply even between portfolios under the same brand. Local context and comparable data are increasingly important when setting rent levels and assessing risk.
Age disparity - who feels the squeeze most?
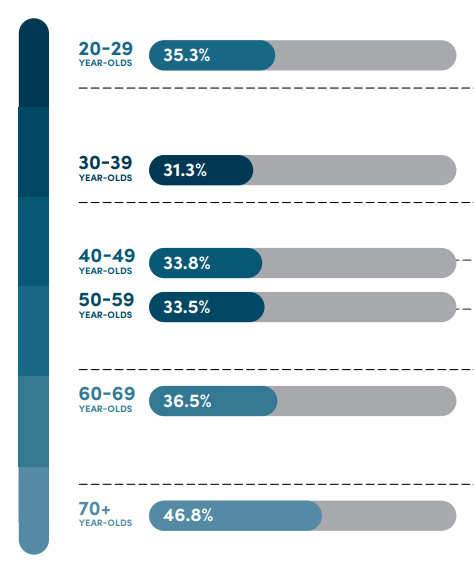
Affordability also differs significantly by age group, with both younger and older renters feeling particular strain. Among 20-29‑year‑olds, tenants spend around 35.3% of income on rent. Early‑career renters often have limited savings and may be building up financial resilience, meaning that even relatively small changes in costs or income can prove challenging.
Tenants in their 30s generally experience a little more headroom. Those aged 30-39 spend around 31.3% of income on rent, making this group the least stretched on average. Rising earnings and career progression often help to improve affordability at this stage. However, as renters move into their 40s and 50s, pressures re‑emerge. Tenants aged 40-49 allocate 33.8% of income to rent, and those aged 50-59 sit close behind at 33.5%. Many in these age groups are juggling family commitments, childcare or other costs, which can compound the impact of housing expenses.
The picture becomes more concerning for older renters. Those aged 60-69 see their rent‑to‑income ratio rise to 36.5%, reflecting the impact of fixed or slower‑growing incomes, such as pensions. For tenants aged 70 and above, the pressure is most acute: this group spends 46.8% of income on rent, significantly above the 40% affordability marker. In other words, those at both the start and the end of the renting journey face some of the greatest strain. They can be excellent tenants, but they often require a more nuanced assessment than a straightforward “do they meet the income multiple?” approach.
London - a closer look at borough‑level affordability
A closer look at London highlights how varied the capital can be. While every London borough sits above the UK average rent‑to‑income ratio, there are meaningful differences across the city. Some borough groupings show very high average rents and strong annual growth, which pushes tenants closer to, or even beyond, the upper comfort limits of affordability. Others have slightly lower rent‑to‑income ratios but still outstrip most regions elsewhere in the UK.
For London‑based landlords and letting agents, this underlines the importance of local insight. A one‑size‑fits‑all affordability approach across the capital can misjudge risk in either direction. Local knowledge and up‑to‑date borough‑level affordability data are essential when setting rents, advising landlords and assessing tenant applications. Small shifts in local employment markets, infrastructure or transport links can quickly change which boroughs feel more or less sustainable for tenants.
Rising guarantor usage - a signal of growing risk
HomeLet’s referencing data shows that guarantors are playing an increasingly important role in keeping tenancies moving. Since early 2025, the share of applications needing a guarantor has risen steadily. By August 2026, just over 21% of tenant applications involved a guarantor.
This trend suggests that more applicants are sitting close to, or just beyond, traditional affordability criteria. Landlords and agents are understandably seeking extra security against arrears and default, especially in a market where legal processes can be time‑consuming and costly. At the same time, families and wider support networks are stepping in to help tenants access and sustain tenancies.
For agents, this growing use of guarantors adds complexity and workload. There are more parties to communicate with, more checks to complete and more documentation to manage. For landlords, guarantors can be an important risk‑management tool, provided that guarantor checks are as robust and thorough as the checks carried out on the tenant themselves.
What this means for letting agents
For letting agents, the data has clear practical implications. First, there is a need to move beyond basic income multiples and consider the broader affordability picture. Rent‑to‑income ratios, age, employment type and guarantor trends all help to build a more complete understanding of each applicant’s position. Two applicants with identical salaries may represent very different levels of risk when you take these factors into account.
Second, data can be used to frame more effective conversations. Explaining decisions through clear statistics helps manage expectations with both landlords and tenants, and demonstrates that your processes are fair and consistent. When landlords understand the affordability constraints in their local market, they are better placed to set realistic rents and choose between applicants.
Finally, protecting reputation and pipelines remains essential. In a tenant‑rich market, speed is important, but sustainability matters even more. Minimising arrears and tenancy breakdowns is key to building long‑term relationships with landlords. Working with a referencing partner that can surface current affordability data and highlight higher‑risk scenarios is increasingly vital to delivering this.
What this means for landlords
For landlords, this report reinforces the need for a more strategic approach to rent setting and tenant selection. Balancing yield with stability is now more important than ever. Setting rents significantly above local affordability norms may increase the risk of longer void periods and higher arrears, particularly in regions that are already stretched.
Being open to guarantors and other structured forms of support can help turn a borderline case into a sustainable, long‑term tenancy, provided robust checks are in place. In a market where tenants often stay longer and legal processes can be slow, focusing on tenant quality rather than simply speed of let is critical to protecting returns. Selecting the right tenant the first time can make a significant difference over the lifetime of a tenancy.
Comprehensive referencing, combined with products such as Rent Guarantee, can help safeguard rental income while still giving good‑quality tenants access to homes. In an environment of tight affordability, these protections provide reassurance to landlords without unduly restricting access to the market for tenants.
To view the full report, click here.